A playlist can be imported through the dashboard. Scroll down to the “Import playlists” section and press the “Import CSV, TXT or zipped SHP file”
When a choice has been made, import the playlist by pressing the “Import playlists” button.
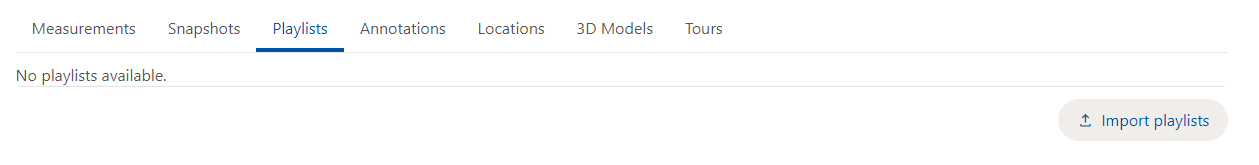
The playlist should now have been added, using the filename, to the list of playlists preceding the import and export functionalities of the playlist.
File Formats
There are two accepted formats: text (either with extension .txt or .csv) and shapefile (.zip extension).
Text Format
The text format, either with extension .txt or .csv, accepts a list of cycloramas, specified by the image id. On it’s simplest format, you can specify a list of image ids:
WE293W4X
WE293W4Y
WE293W4Z
Optionally, for each line, you can specify a label for each image, using the char | (pipe) as separator between the two fields:
WE293W4X|Panorama Test 1
WE293W4Y|Panorama Test 2
WE293W4Z
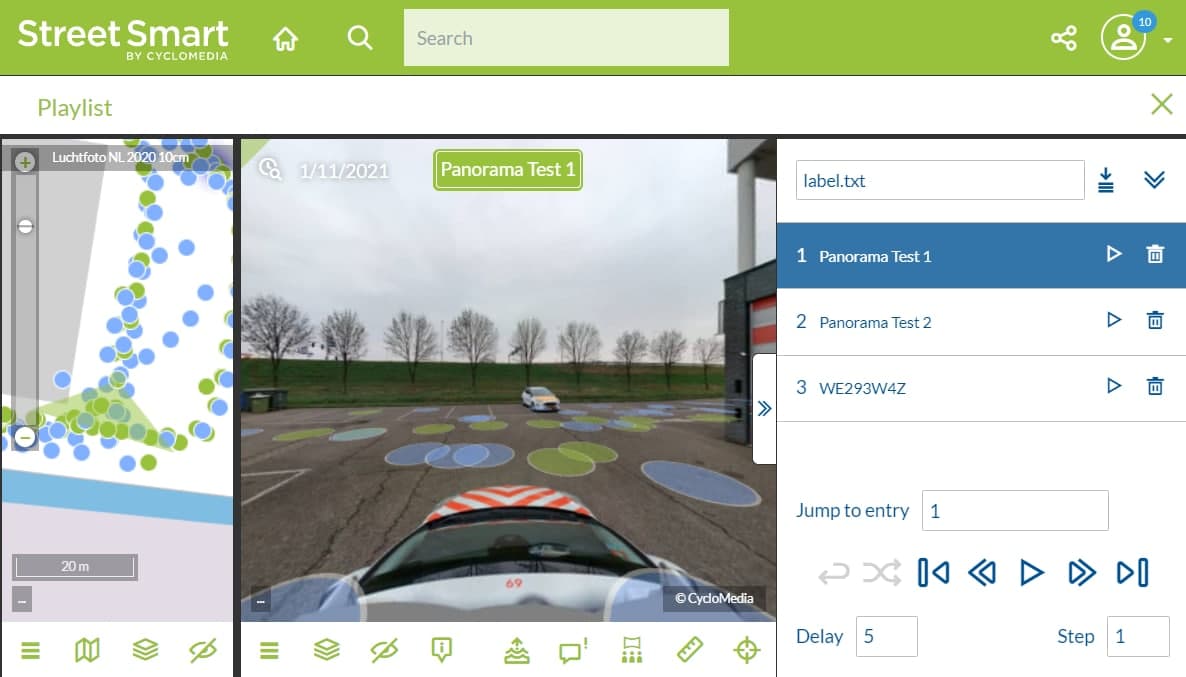
If you don’t specify a label, if would show the image id as a label.
You can also specify an orientation field, which is made of 3 numbers – yaw (horizontal turn), pitch (vertical turn) and hFov (zoom), and each number can be integers or floats – with one space between them. In this case, the orientation is the second parameter and the label is the third parameter, and if you don’t want a label, you must specify the separator and leave it empty, otherwise the orientation would be treated as a label. Let’s check the example:
WE293W4X|-110 1.5 10|Panorama Test 1 with orientation
WE293W4Y|-80 1.5 20|Panorama Test 2 with orientation
WE293W4Z|-25 2 30|
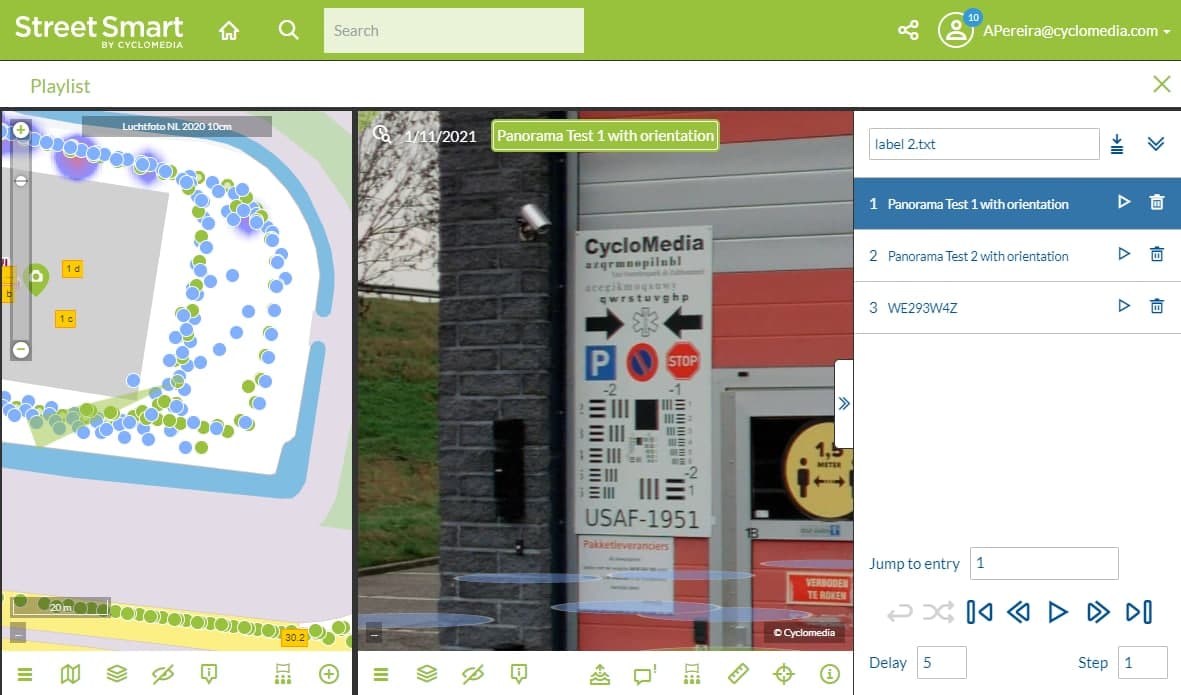
If the orientation field doesn’t have 3 numbers, the playlist import will fail.
Shapefile Format
Shapefiles (with .zip extension) are also valid. The shapefile may have points or lines. For lines, the system will automatically select the cycloramas which position is close to the path specified by the line. Alternatively, points will select the closest cyclorama, as well as the orientation to face the specified coordinate.
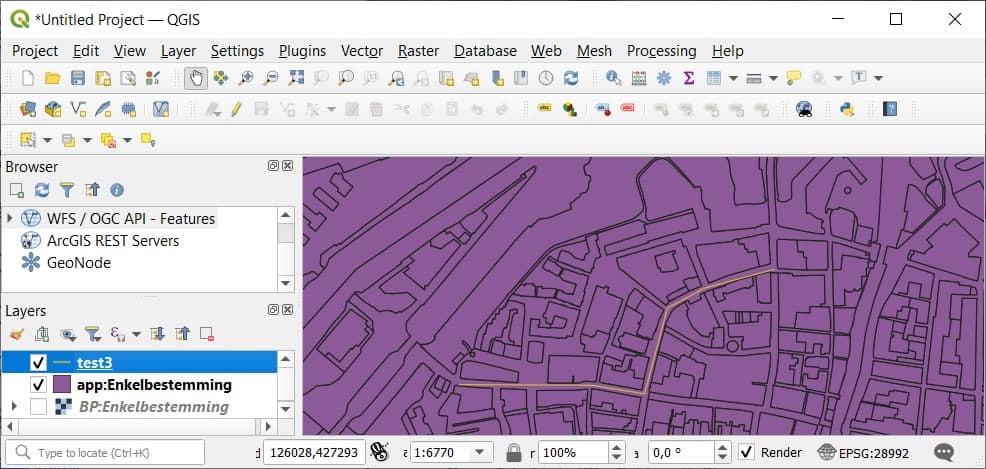
For instance, if you draw a LineString on QGIS or ArcGIS:
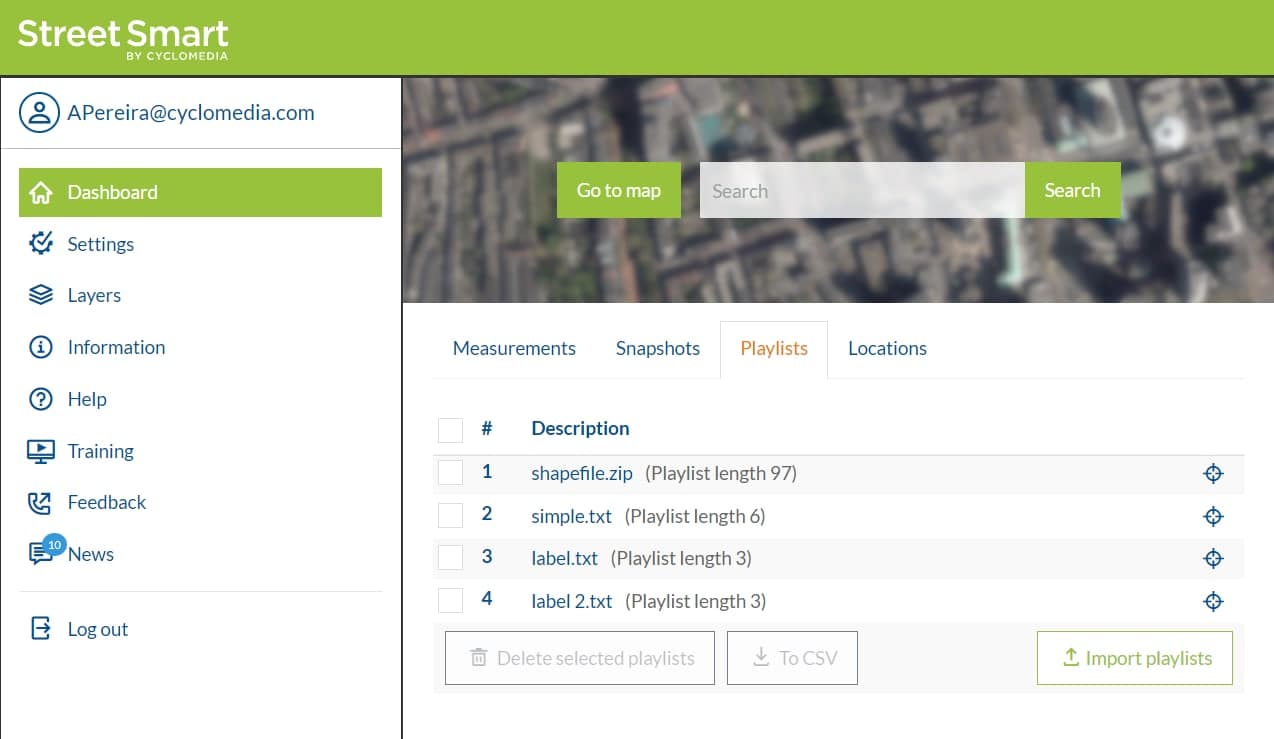
After importing the zipped shapefile, you are able to see it on the Playlists list:
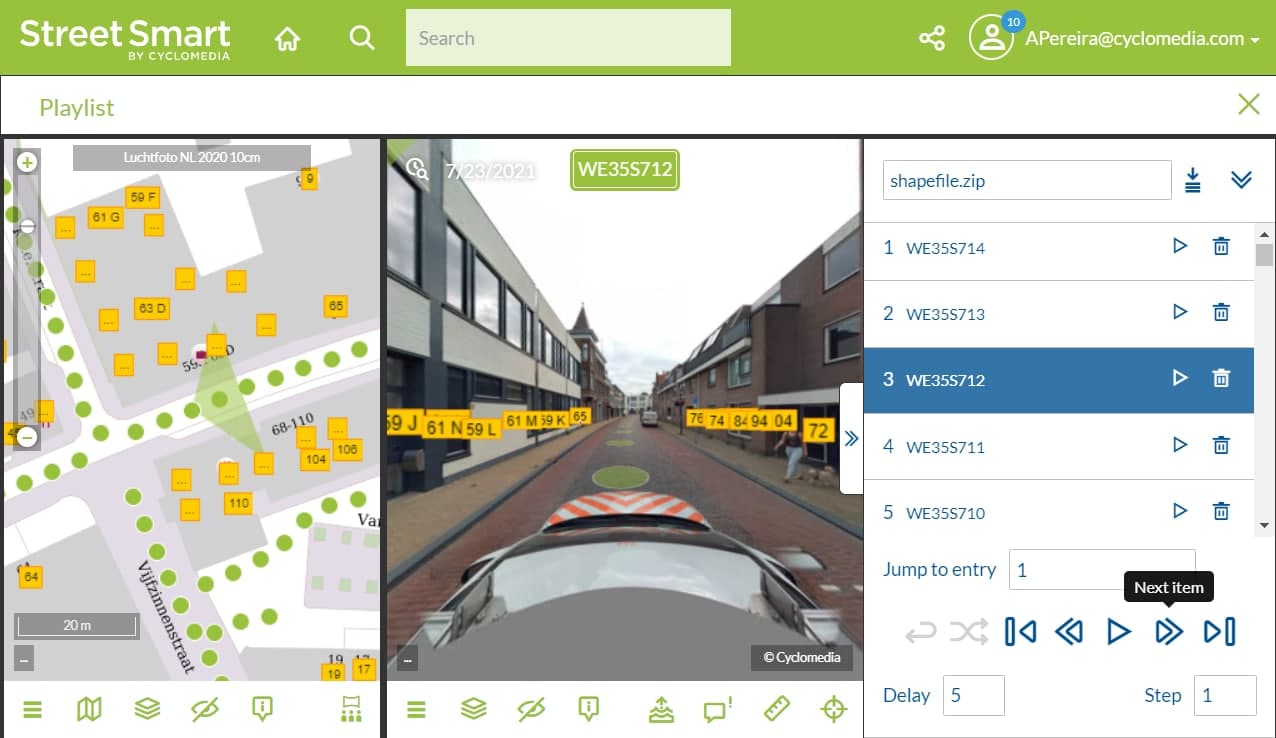
And then see cycloramas that are along the line drawn:
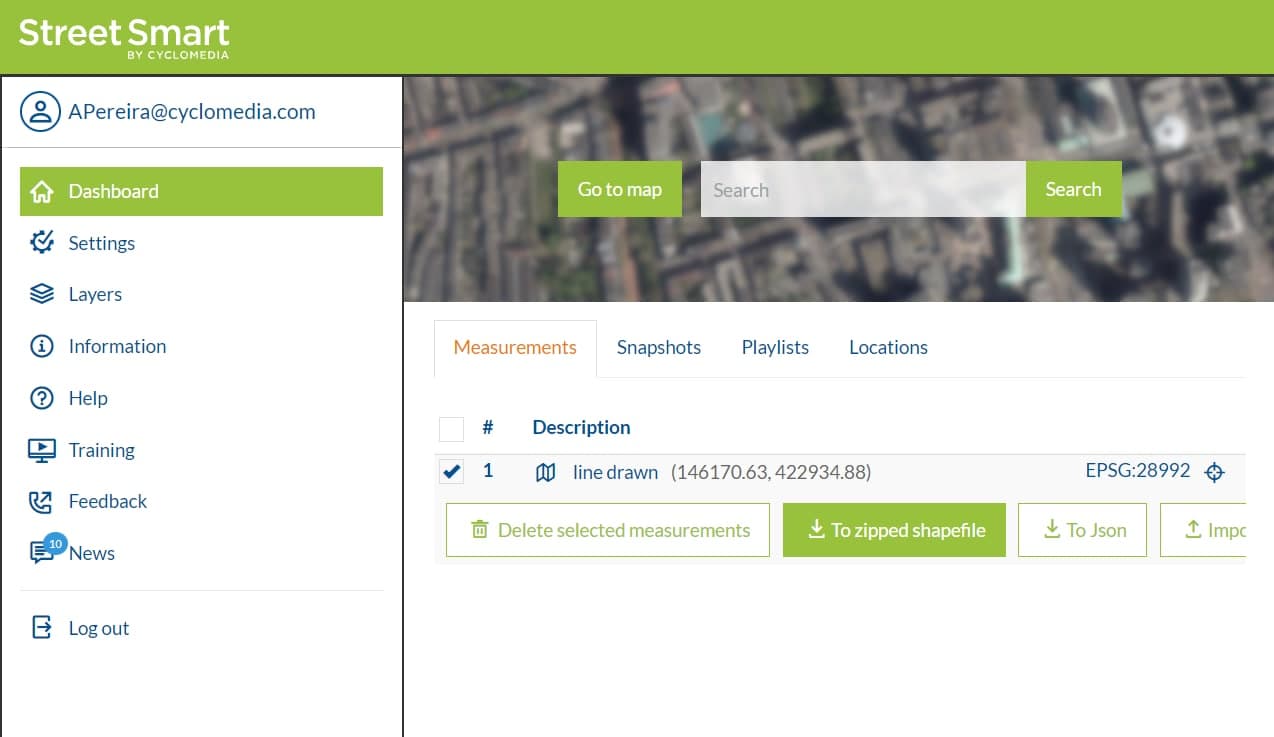
As an alternative to draw lines manually with GIS software like QGIS or ArcGIS, you can also use StreetSmart to generate the shapefile. To do so, open the map, click on the Start measuring button (ruler icon on the bottom right) and choose Distance.
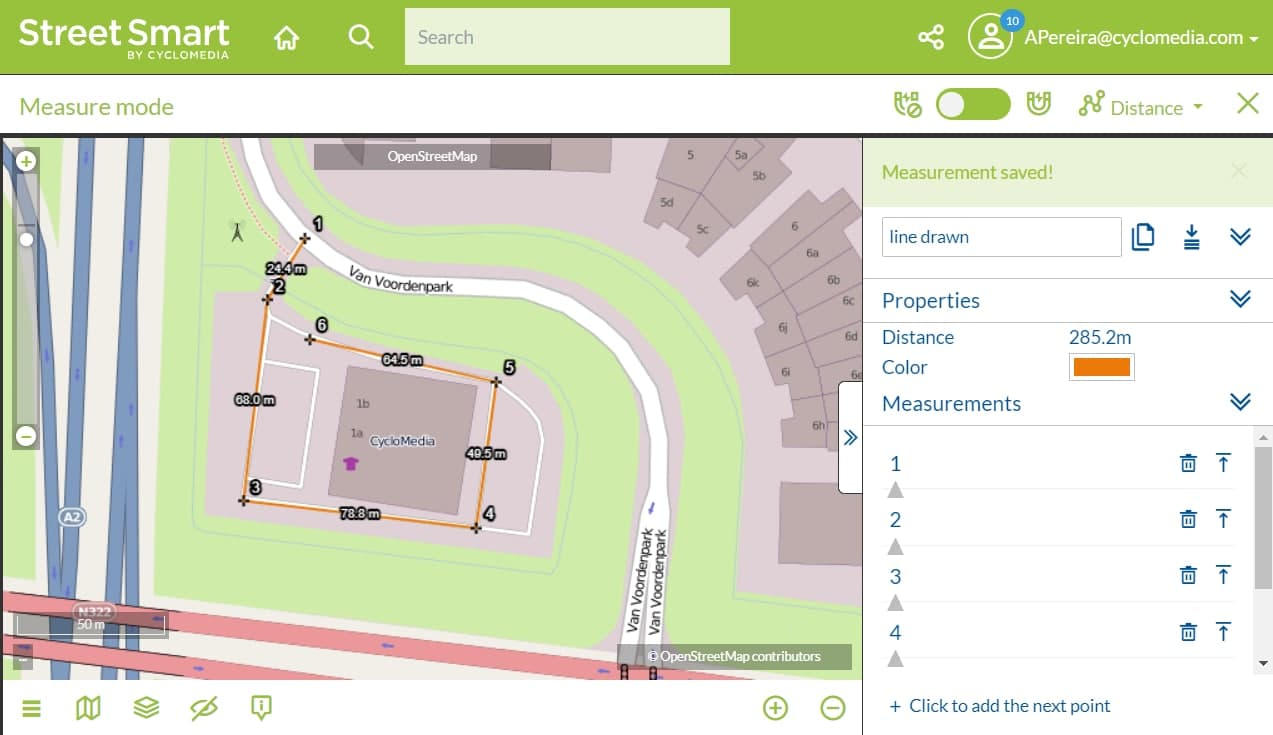
Then, go back to the Dashboard, on the Measurements tab, select the measurement and click on the button To zipped shapefile.